Our new pool location plots are contained in an easy-to-use Google Earth KML
(Keyhole Markup Language) file. Target icons are color-coded by
classification. One advantage of
this plot is the ability to view actual snippet files within Google Earth. The
visual and interactive representation of your districts problem pools is
particularly useful if you do not utilize ArcGIS or related mapping systems.
Viewing this KML, you can easily determine where bad pools are concentrated --
and subsequently where mosquito breeding may be more prevalent.
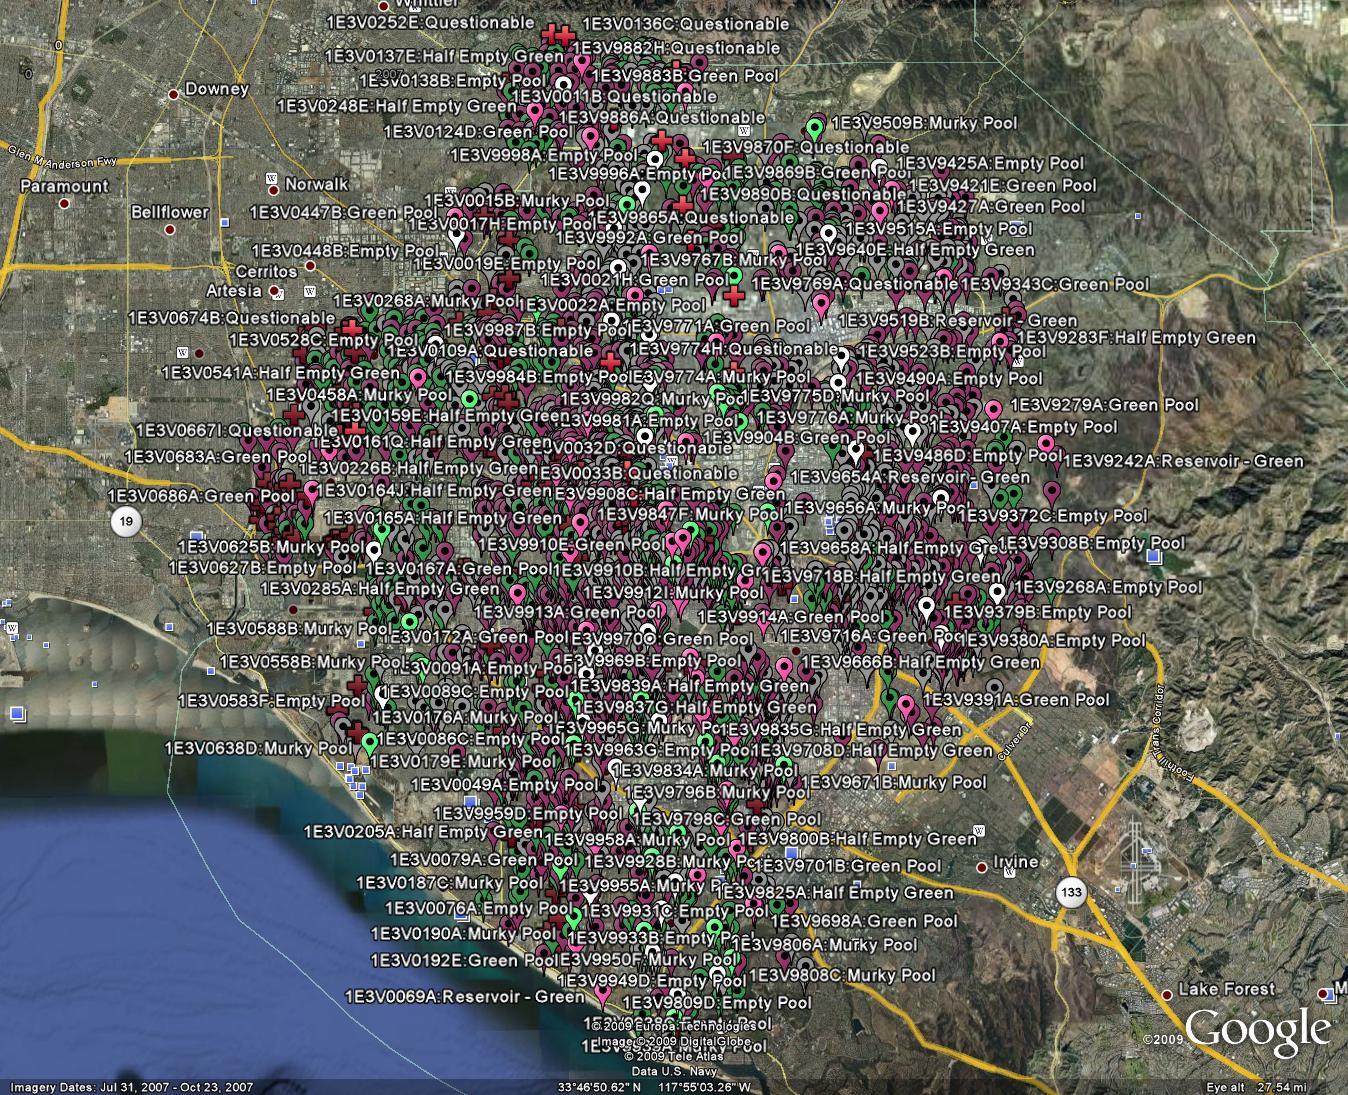
This first image is an overview of a pool plot KML in Orange County,
California. There are just shy of 3,100 targets plotted here. Click on the image
for the full-size screenshot.

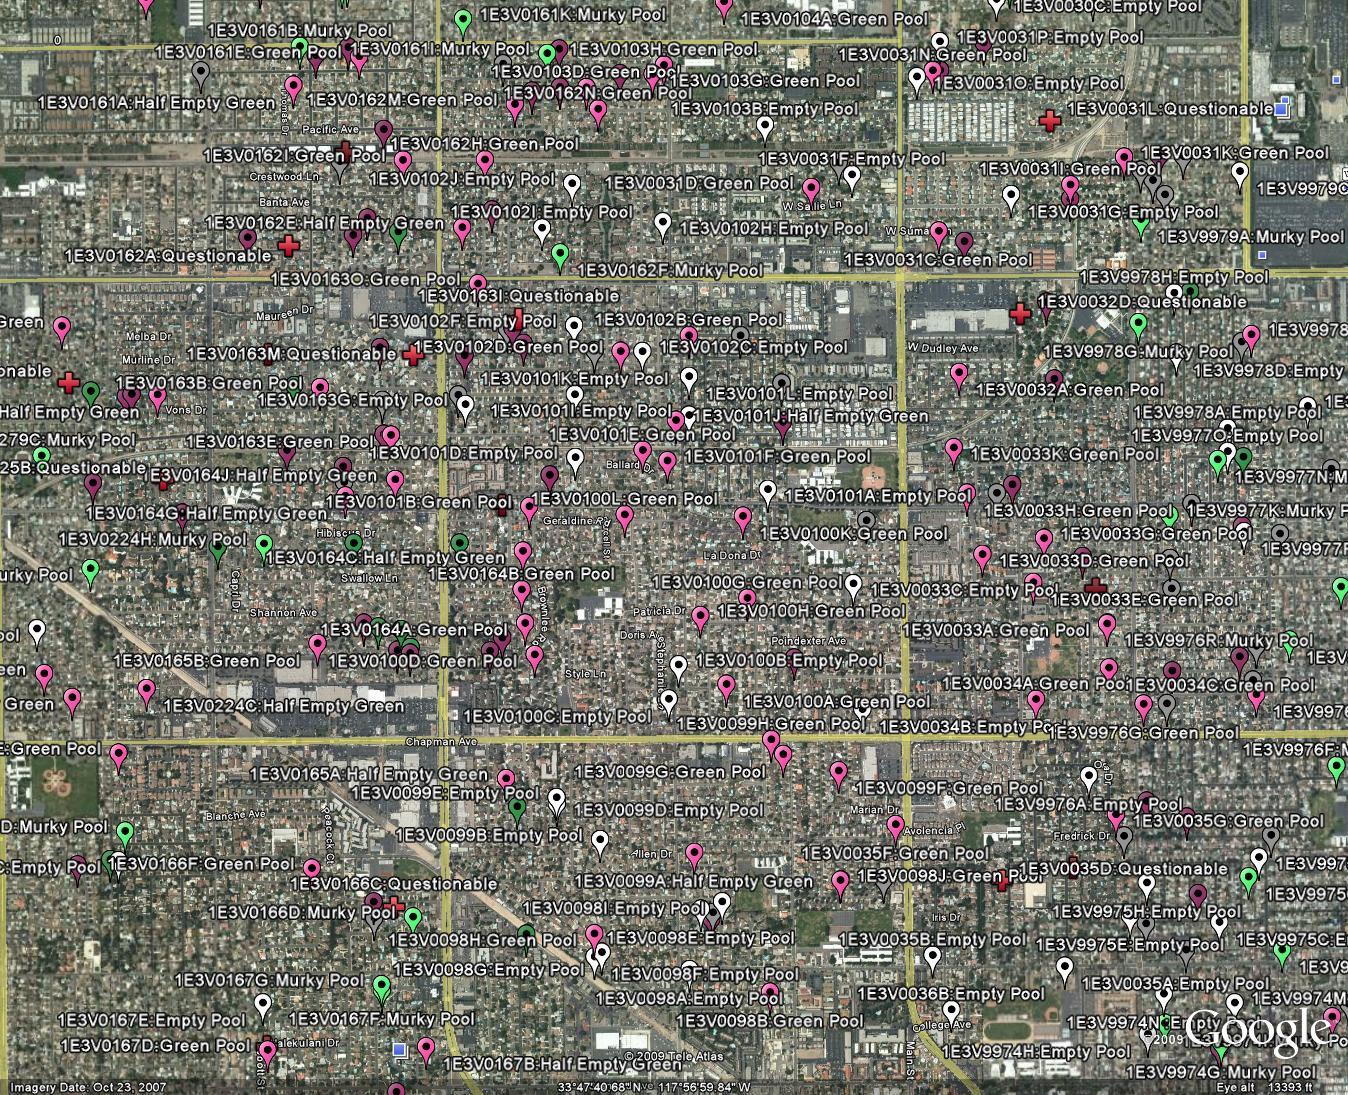
The next image shows a closer view of the targets plotted in Google Earth.
You can see the concentrations of pools in some locations relative to others.

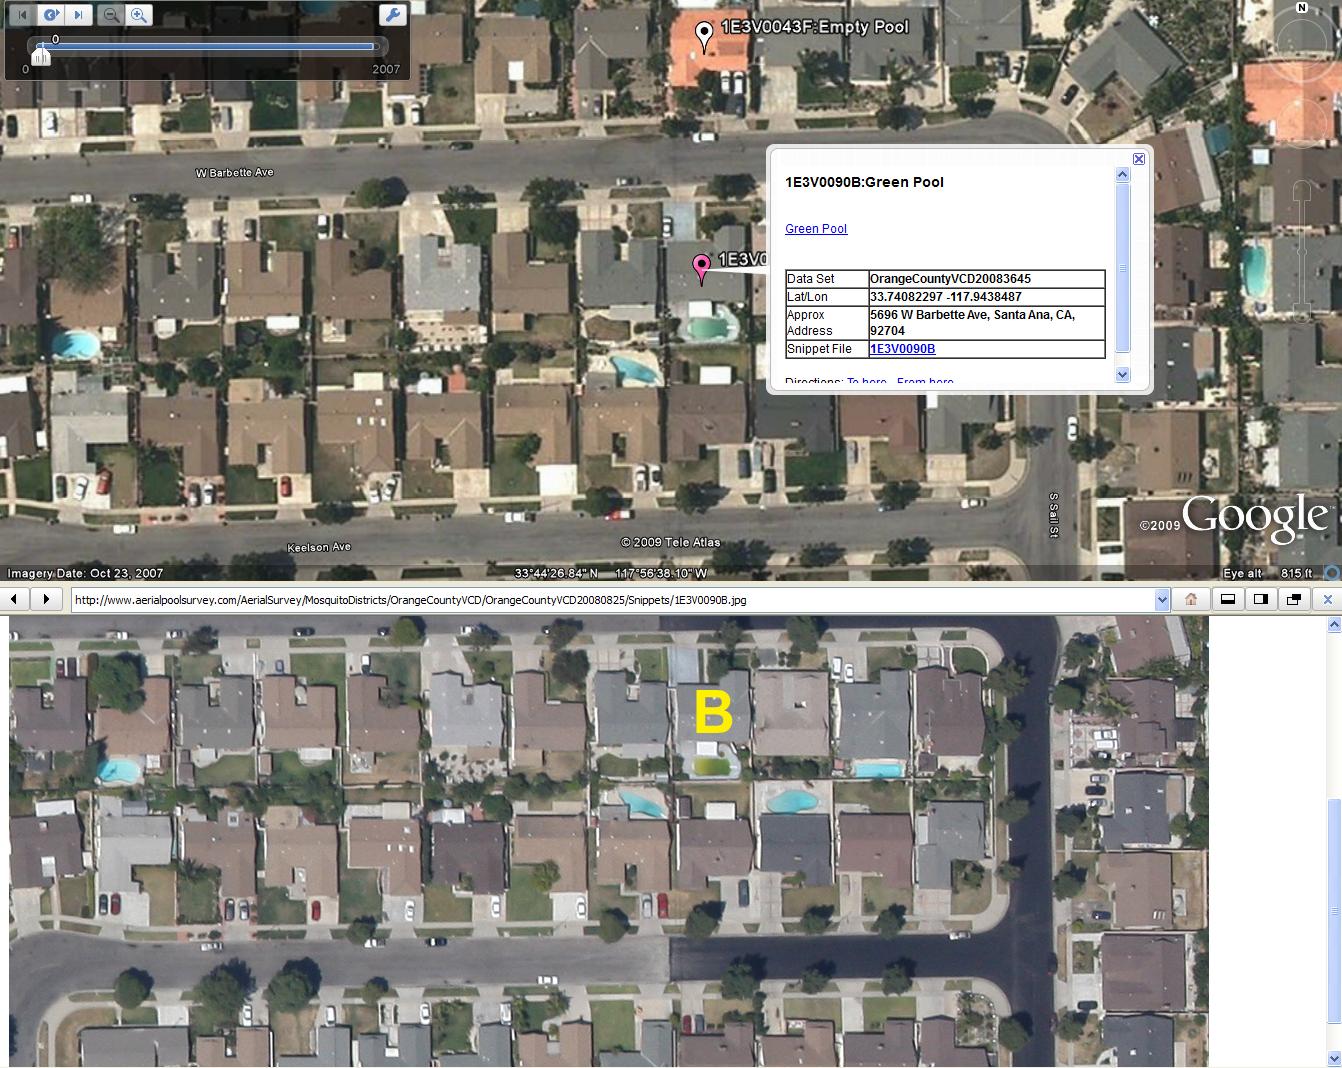
The final image shows an actual image snippet displayed in the lower pane of
Google Earth, with the Google Earth imagery displayed above. Notice the
increased clarity of the image snippet compared to the satellite imagery. The
satellite imagery was taken October 23, 2007. Our imagery was taken on August
25, 2008 and delivered to the Orange County Vector Control Department customer
in one week. The green pool (Target B) was only murky one year prior, but was
neglected by homeowners to the point of turning dark green, as you can see in
our survey image. This pool needed swift attention from vector control
specialists.

As of April 2009, you
can now generate your own custom pool location KML file with our software.
If you
update your database of pools, the Google Earth KML pool plot originally
provided to your district may be outdated. Our software allows you to
generate the KML with ease, and includes a few new features not previously
included in prior pool location KML files. For example, your new pool plot
will show the date that the technician report was printed. Please contact us
for a copy of the new program and instructions on how to use it.